Windows Log Capture Guide_Rev1.0
Document Revision History
Version |
Date |
Author |
Changes |
|---|---|---|---|
Rev1.0 |
2026-04-25 |
ljz |
Initial Release |
1 Introduction
This document describes how to use the PC tool to capture runtime logs of LTE-EC71X series modules in a Windows environment, to assist users and engineers in analyzing module operation status, network performance, and troubleshooting abnormal issues.
2 EPAT Overview
EPAT: EigenComm Platform Analysis Tools. Used for capturing and analyzing EigenComm UE Logs, debugging and analyzing UE.
EPAT offline mode: Used to open and display UE logs. In offline mode, multiple EPAT processes can be launched simultaneously to open multiple UE logs for comparison.
EPAT online mode: Used to capture UE logs and monitor UE online status. In online mode, only one EPAT instance can be launched.
2.1 Log Capture Method Selection
Choose the appropriate log capture method based on the debugging scenario:
Method |
Use Case |
Description |
|---|---|---|
Serial port tool (Chapter 4) |
Quick APP layer log viewing, application logic debugging |
APP log only, no baseband information |
EPAT online (Chapter 5) |
Network registration, signaling interaction, baseband issues |
Complete baseband + APP log, real-time capture, requires database file |
EPAT offline |
Offline analysis of saved zip log files |
Can open multiple logs simultaneously for comparison, requires pre-saved log files |
Wireshark pcap (5.7.5) |
Deep network protocol stack and packet analysis |
Professional network analysis tool, requires export from EPAT |
Recommendations:
Beginners or simple APP debugging: Use serial port tool (Chapter 4)
Network issues, field testing, baseband info needed: Use EPAT online (Chapter 5)
Network protocol detail analysis: Capture with EPAT first, then export as pcap for Wireshark analysis (5.7.5)
3 Environment Setup
3.1 Confirm Log Output Port
APP log output port can be confirmed or modified in LSDK/config/default.ini. A full clean build is required after modification:
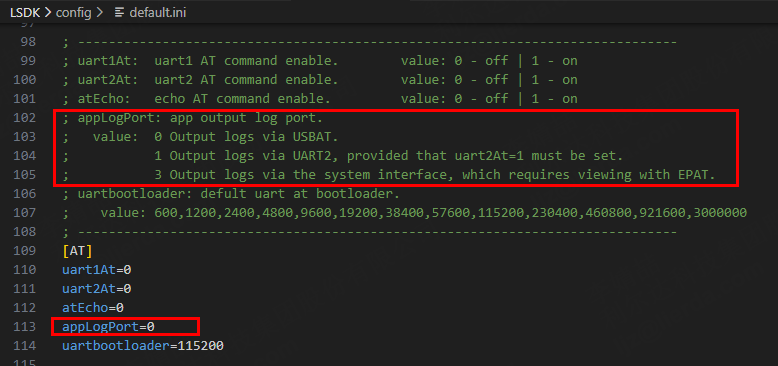
Function |
Command |
Description |
|---|---|---|
Output to USB AT |
appLogPort=0 |
None |
Output to UART2 |
appLogPort=1 |
uart2At must be set to 1 |
Output to EPAT tool |
appLogPort=3 |
Use EPAT.exe |
The baseband log output port is configured via the logPortSel parameter, also located in LSDK/config/default.ini. A full clean build is required after modification:
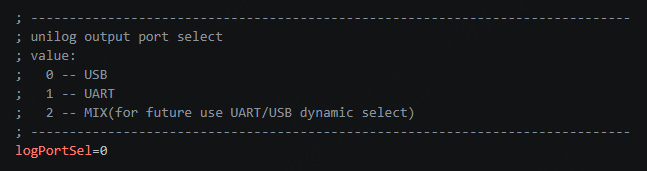
Function |
Command |
Description |
|---|---|---|
Output to USB |
logPortSel=0 |
Default configuration |
Output to UART |
logPortSel=1 |
None |
Output to MIX |
logPortSel=2 |
Reserved, UART/USB dynamic selection |
3.2 Preparation
Please prepare the following tools and conditions:
Target module (device from which logs need to be captured);
The module APP supports three log output methods:
USB AT log output (default): Connect the module’s USB interface, view using a serial port tool. The device name in Device Manager is: Lierda At Port;
USB Log output (default): Connect the module’s USB interface, view using the EPAT tool. The device name in Device Manager is: Lierda Log Port;
UART 2 serial output: By default, connect AUX_TXD, AUX_RXD, GND pins, view using a serial port tool;
PC log capture tool: Serial port tool or EPAT.exe;
If using EPAT, also prepare the database file matching the firmware version (e.g.,
LSDK/gccout/[PROJECT]/comdb.txt). If comdb.txt does not match, log parsing errors may occur, leading to failure in issue diagnosis.For USB driver installation, please refer to “USB_Driver_Installation_Guide.md”.
Note:
If you do not have EPAT.exe, please contact technical support to obtain it;
The database file must match the firmware version.
4 Serial Port LOG Capture
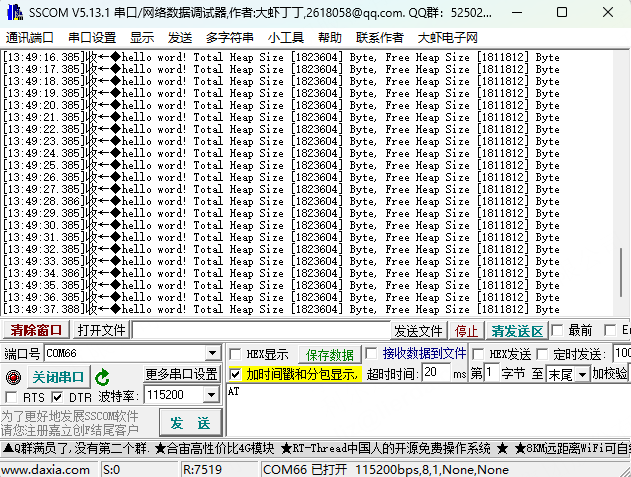
There is no specific requirement for the serial port tool. Open any serial port tool, set baud rate to 115200, select the port corresponding to the output method configured in section 3.2 and open it to view APP logs.
5 EPAT LOG Capture
5.1 Launch EPAT Tool
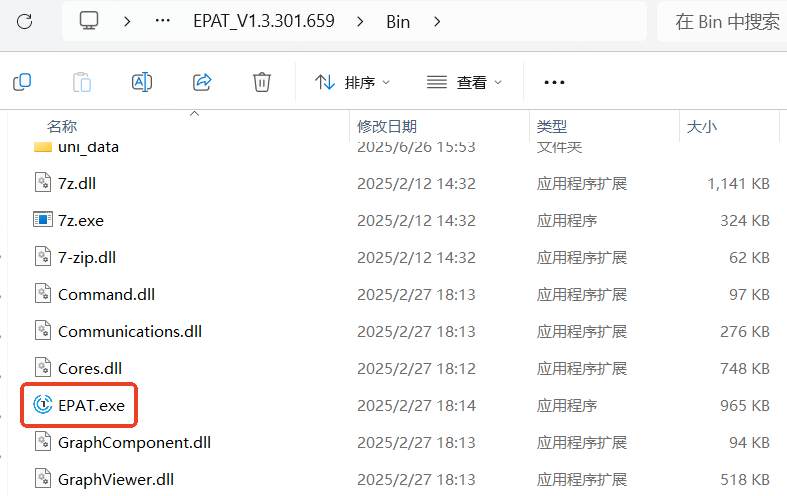
Double-click to run EPAT.exe. Tool versions may vary; contact FAE for the latest version if needed.
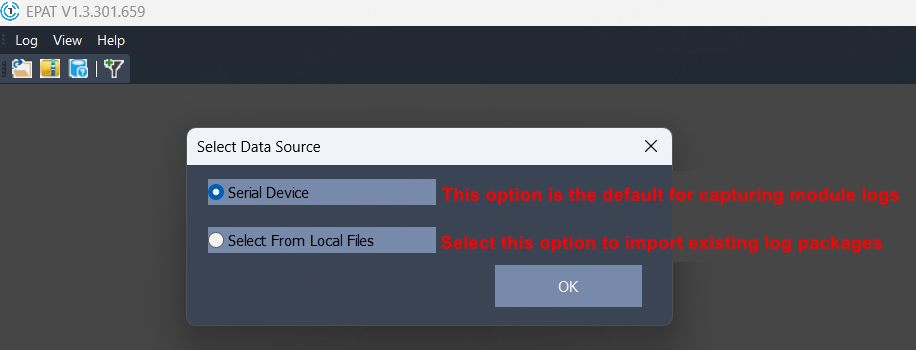
When opening EPAT for the first time, a data source selection window will pop up:
Select:
Serial DeviceClick
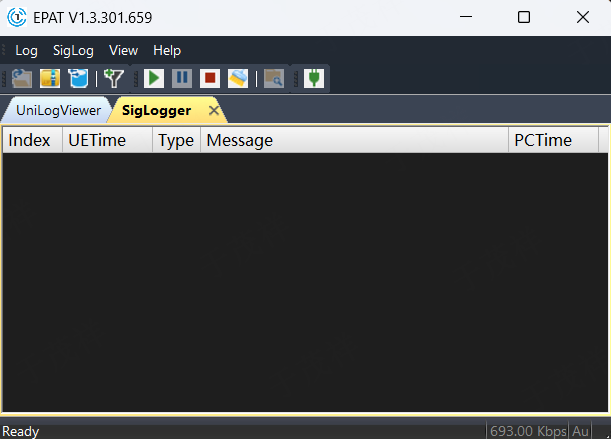
OKto enter the main interface
5.2 Connect UE
5.2.1 Device Dialog
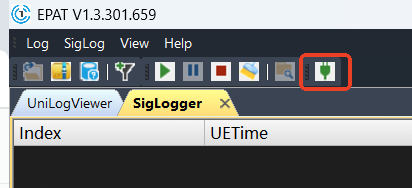
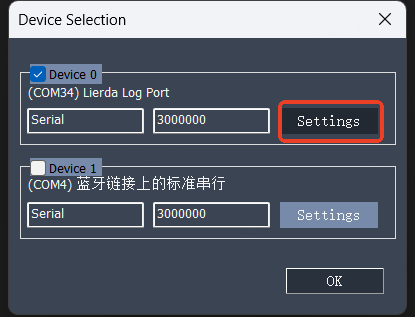
Click the “Serial Port Settings” icon, then click “Setting” in the “Device Communication” popup.
5.2.2 Configure Connection Parameters
Select the correct log port (Lierda Log Port) and configure the baud rate (EPAT default 3000000).
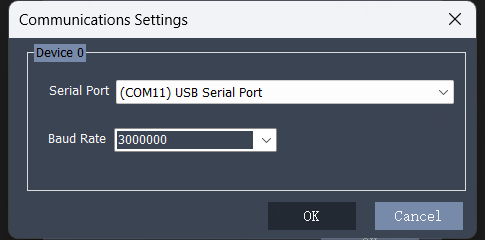
After configuration, click OK to return to the main interface.
Note:
If the USB port is not enumerated, please refer to “USB_Driver_Installation_Guide.md” for driver installation.
The DBG serial port baud rate defaults to 3M. It can be set to other baud rates; changes take effect after restart.

USB devices in Device Manager
5.2.3 Check Connection Status
The connection status can be viewed in the EPAT status bar.
Status |
Display |
|---|---|
Connected |
|
Not connected |
|
Connection failed |
|
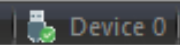
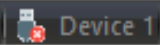

5.3 Update DB
5.3.1 Check Status
The Database State button in the toolbar has three states to indicate database matching status.
Status |
Display |
|---|---|
UE DB read failed |
|
UE DB mismatch |
|
UE DB matched |
|
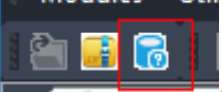
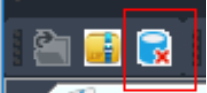
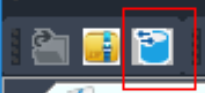
Click the “Database Update” icon in the toolbar.
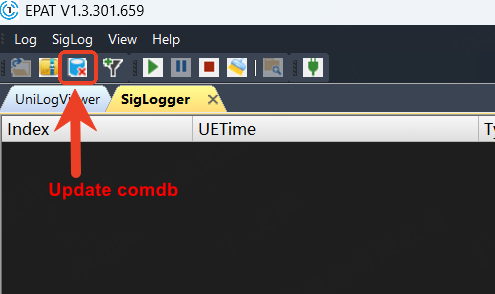
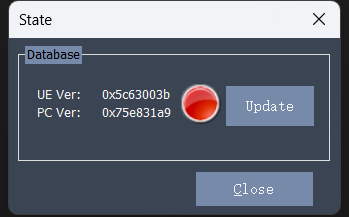
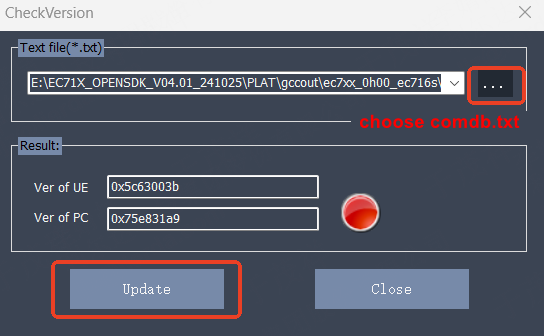
In the popup window, click Update, then select the matching comdb.txt file.
5.3.2 Update Database
In the database update interface, manually update the corresponding database file.
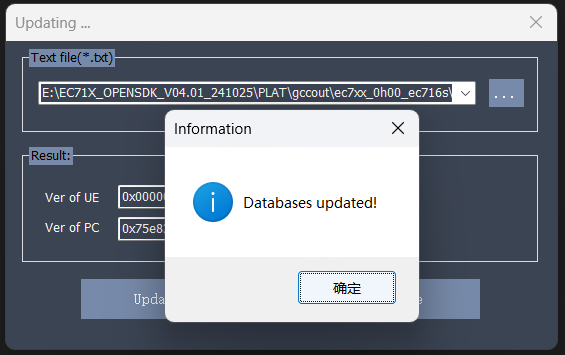
After the database version update is complete, a prompt appears: Databases updated!
After updating, the Check DB Version Result area displays the result:
Green: Success and matched
Red: Mismatch
Gray: Failed to read UE DB
Click Close to return to the main interface.
Note:
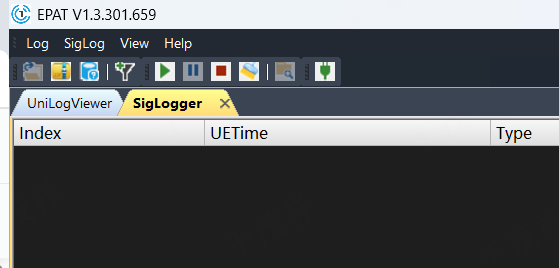
The question mark in the database icon will automatically disappear when logs are successfully captured.
5.4 Start/Pause/Stop/Clear Functions

5.4.1 Start
Starts the Viewer to begin capturing logs.
5.4.2 Pause
The Viewer stops refreshing log display but continues saving logs. Used when you are unsure whether the current log has captured the UE fault and want to temporarily check while log writing continues.
5.4.3 Stop
The Viewer stops refreshing log display and stops saving logs. Used when you confirm the current log is what you want to save and subsequent logs are not needed.
5.4.4 Clear
Clears the Viewer and opens a new log file to continue writing logs.
5.5 Log Capture
5.5.1 Start Log Capture
Click the Start button described in section 5.4.1 to begin log capture.
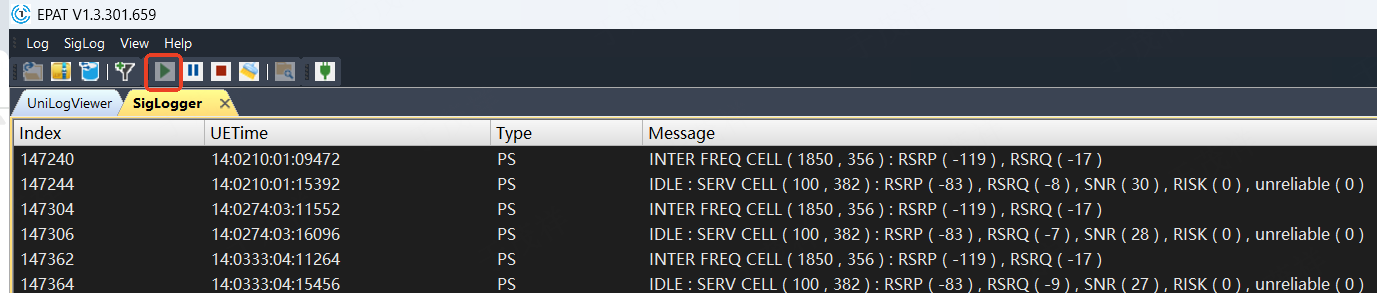
After logs are successfully output, the database icon turns green indicating the database matches the module firmware.
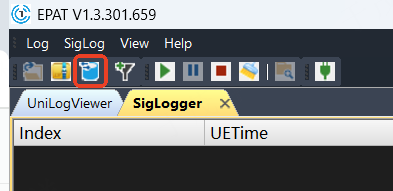
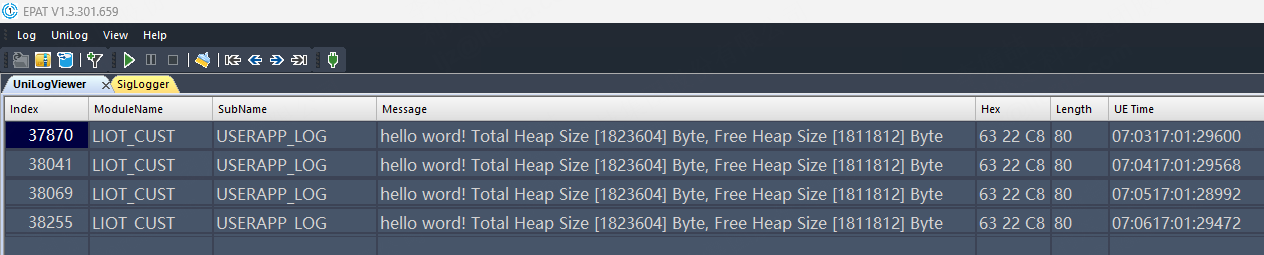
5.6 Filter APP Logs
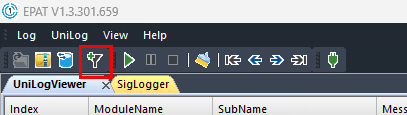
Click the log filter icon.
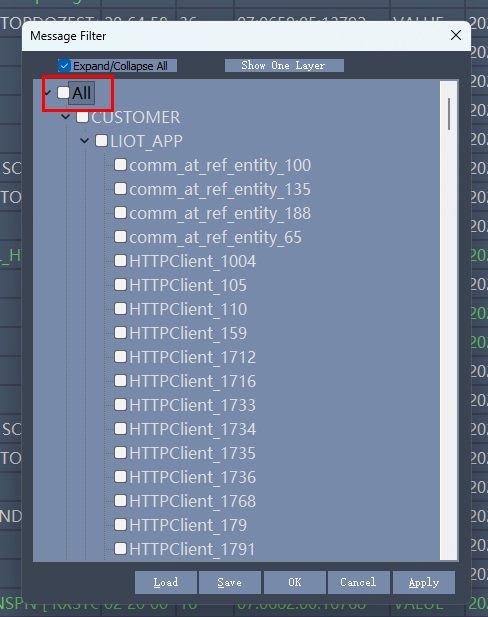
First click the checkbox before “All” to deselect all logs.
Check CUSTOMER -> LIOT_CUST -> USRTAPP_LOG, then click Apply and OK.
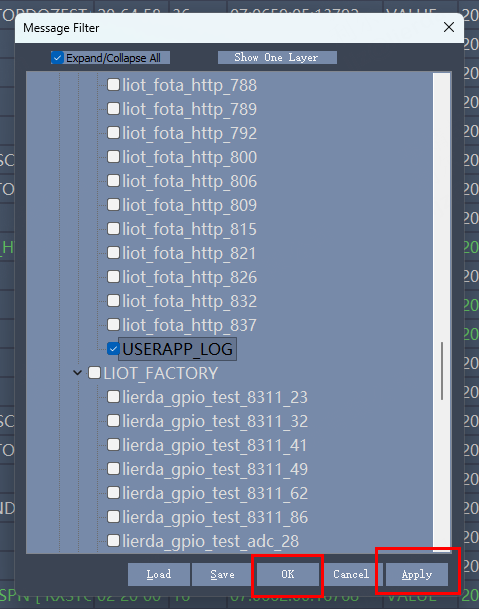
Now the log viewer displays only the APP logs.
5.7 Log Saving
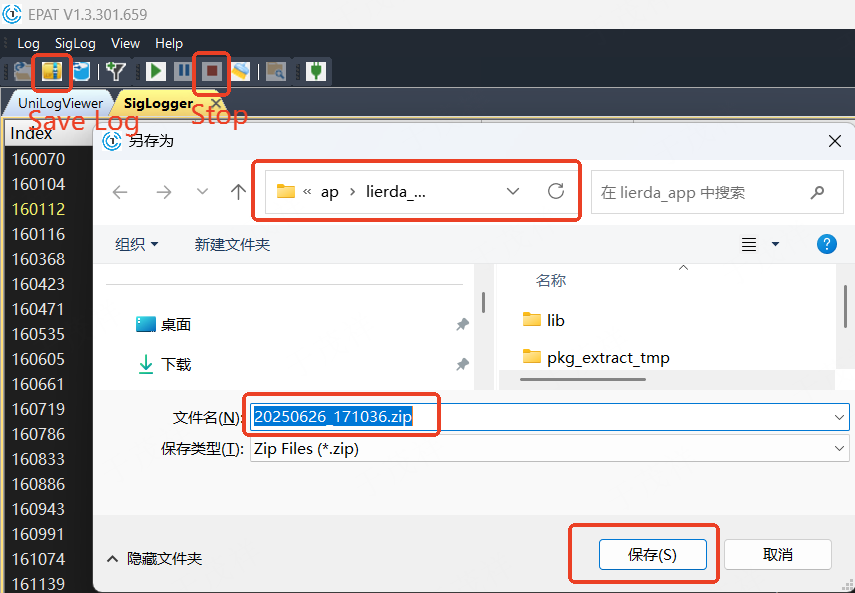
5.7.1 Manually Save Log File
After log capture is complete, click the “Stop” button, then click the “Save” icon to save the captured log as a .zip compressed file.

5.7.2 Auto-Save and Split-Save Log Files
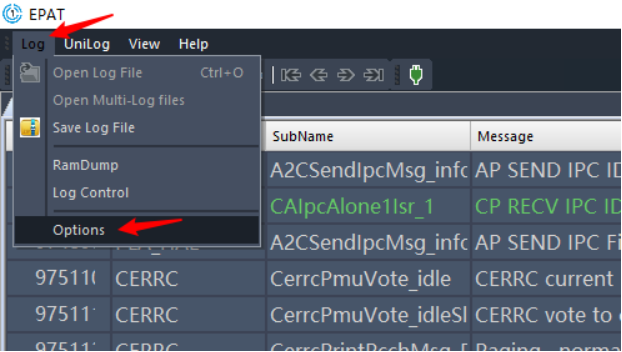
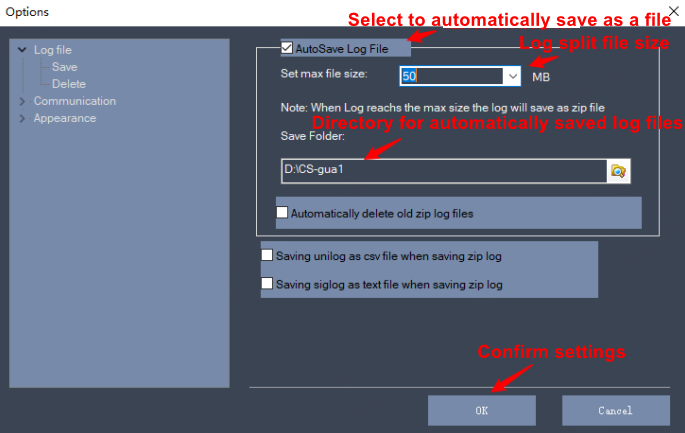
For long-term testing and issue reproduction, it is recommended to enable the log “split-save” function:
Menu path:
Log -> OptionsEnable timed or size-based split-save options
If this function is not available, contact support for the latest tool version
After selecting AutoSave Log File, set the file size in “Set max file size”. When the log file reaches this size, it is automatically saved to disk. Specify the save location in the Save Folder input box.
If the option “Automatically delete old zip log files” is selected, auto-saved zip log files exceeding the preset maximum count will have old files automatically deleted. The default count is 50.
Note:
This parameter must be set for long-term testing. Without it, logs are saved as a single file that grows over time, making transmission and analysis difficult.
5.7.3 Save Text Log
There are two options to control whether unilog or siglog is saved as a csv or text file when saving zip log files.
If “Saving unilog as csv file when saving zip log” is selected, the current unilog data is saved as a csv file with the same directory and name as the zip log file.
If “Saving siglog as text file when saving zip log” is selected, the current siglog data is saved as a text file with the same directory and name as the zip log file.
5.7.4 Delete
Select the Delete option under the Log file category to display the configuration page as shown below:
After selecting “Automatically delete old log files”, local log files exceeding the specified count will have old files automatically deleted. The count is determined by “Number of local files”.

5.7.5 Convert to Wireshark Packets
EPAT supports converting logs to .pcap format for Wireshark analysis:
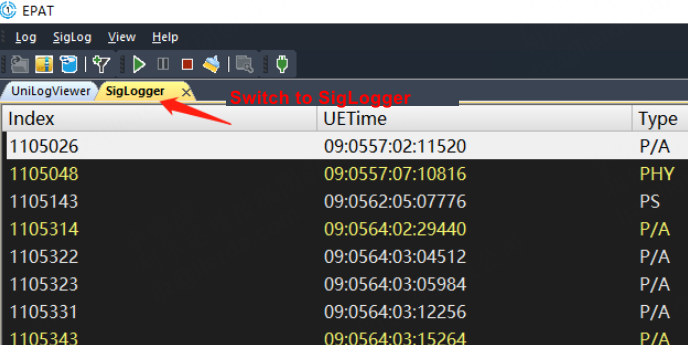
Switch the log window to SigLogger
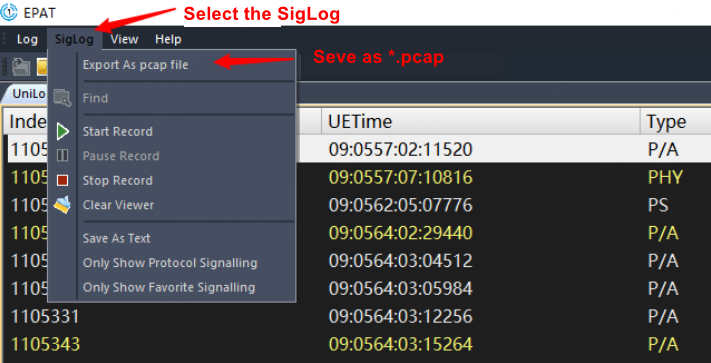
Select the export option from the menu
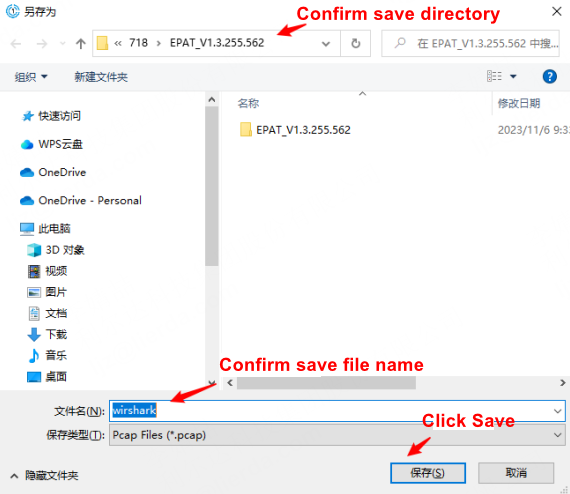
Set the save path and filename
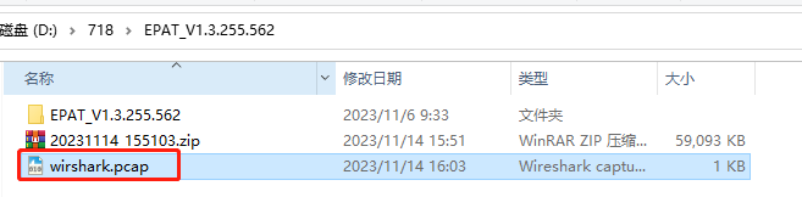
Open the
.pcapfile with Wireshark for packet analysis
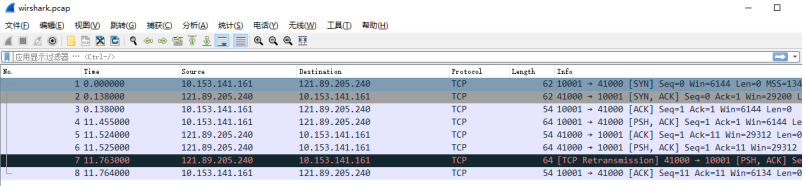
Perform network packet analysis using Wireshark. Here is a simple example of TCP data send/receive flow.
5.8 Submitting Logs to FAE
When submitting logs to FAE for analysis assistance, please prepare the following materials:
Material |
Description |
|---|---|
zip log file |
The |
comdb.txt |
The database file matching the firmware version |
Reproduction timestamp |
The exact time the issue occurred (accurate to seconds), to help FAE quickly locate the issue in logs |
Issue description |
Brief description of the issue, reproduction steps, and whether it is consistently reproducible |
Note: Please ensure comdb.txt matches the firmware version, otherwise FAE will also encounter log parsing errors.
6 Important Notes
Use the latest version of EPAT.exe. Contact support to confirm the version;
The database file must match the firmware. Version mismatch will cause log parsing failure;
If EPAT crashes or cannot open, terminate all processes, re-extract, and restart;
7 FAQ
7.1 Cannot find mfc140u.dll
Please refer to DingTalk document for “Cannot find mfc140u.dll.mp4”
Copy the following 3 files to the EPAT root directory:
7.2 Port Not Found in Device Manager
Symptom: After connecting the module via USB, Lierda At Port or Lierda Log Port is not visible in Device Manager.
Troubleshooting steps:
Confirm the USB cable is properly connected;
Confirm the module has been powered on successfully;
Confirm USB function is not disabled:
usbCtrlinLSDK/config/default.inimust not be set to 2;Open Device Manager and check for unrecognized devices (yellow exclamation mark);
If there are unrecognized devices, the USB driver is not installed. Please refer to “USB_Driver_Installation_Guide.md” to install the driver;
If ports are still not visible after driver installation, try a different USB port or restart the computer.
7.3 Cannot See APP Log in EPAT
Symptom: EPAT is connected and baseband logs are outputting normally, but APP layer logs are not visible.
Troubleshooting steps:
Confirm
appLogPort=3inLSDK/config/default.ini. APP logs are only output to EPAT when set to 3;Confirm a full clean build was performed and new firmware was flashed after modification;
Confirm the EPAT filter has
CUSTOMER -> LIOT_CUST -> USRTAPP_LOGchecked (refer to section 5.6);If the
USRTAPP_LOGoption is not available in the filter, the comdb.txt does not match the firmware. Please update the database file.
7.4 No Log Output After EPAT Connection
Symptom: After clicking Start in EPAT, neither baseband nor APP logs are output.
Troubleshooting steps:
Confirm the correct port is selected: choose the COM port corresponding to Lierda Log Port in Device Manager;
Confirm the baud rate matches: EPAT defaults to 3000000. If the module side has been modified, they must match;
Confirm
logPortSel=0(USB output) inLSDK/config/default.ini. If set to 1 (UART), logs will not be output via USB;Confirm the EPAT status bar shows “Connected” status (refer to section 5.2.3);
Try restarting the module and wait for USB re-enumeration before clicking Start.